Dice Coefficient vs. IoU in Medical Image Segmentation
The Dice Coefficient and Intersection over Union (IoU) are widely adopted metrics for segmentation quality assessment. Both are considered F-measure (or F-score) based metrics [1] and that quantify the similarity or overlap between a segmentation and its reference or ground truth.
While commonly applied, these metrics are not identical. Understanding their differences, strengths, and limitations helps researchers and practitioners choose the most appropriate measure for their application, whether the objective is maximizing overlap, penalizing misalignment, or evaluating small structures.
Acronyms and Definitions
Before diving deeper, it is useful to clarify a few acronyms and definitions:
| Acronym | Meaning |
|---|---|
| IoU | Intersection over Union |
| DSC | Dice Similarity Coefficient |
| TP | True Positive |
| FP | False Positive |
| FN | False Negative |
| GT | Ground Truth |
| S | Predicted Segmentation |
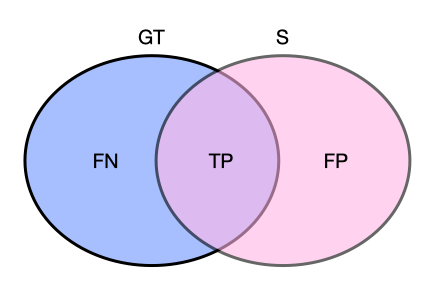
In image segmentation, the terms true positive (TP), false positive (FP), and false negative (FN) are defined as follows [2]:
| TP: The area or number of pixels of the intersection between GT and S TP = GT \cap S |
| FP: The area of S outside GT FP = (GT \cup S) - GT |
| FN: The area of pixels that the model failed to predict FN = (GT \cup S) - S |
To help visualize these concepts, the following diagram demonstrates how TP, FP, and FN relate to the predicted segmentation versus the ground truth.
Intersection over Union (IoU)
- IoU, also referred to as Jaccard Index,
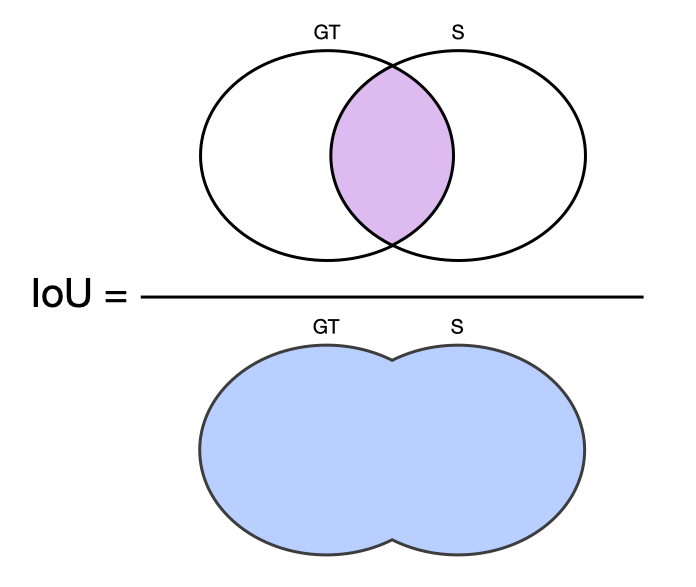
measures the overlap between a predicted segmentation S and the ground truth GT. - IoU is calculated as the ratio of the intersection of S and GT to the total area covered by both:
\displaystyle IoU = \frac{\lvert GT \cap S \rvert}{\lvert GT \cup S \rvert} - If TP = GT \cap S
and
GT \cup S = TP + FN + FP (see figure above),
we can then rewrite the formula as:
\displaystyle IoU = \frac{TP}{FN + TP + FP}
The following illustrations provide a visual representation of the IoU formula.
Dice Similarity Coefficient (DSC)
- The Dice Similarity Coefficient, also called the Sørensen-Dice index, corresponds to the F1-score.
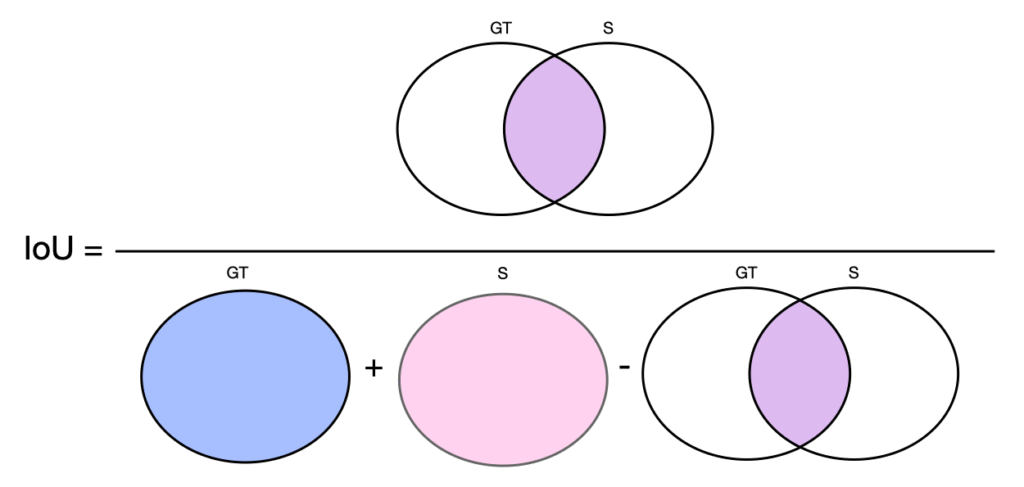
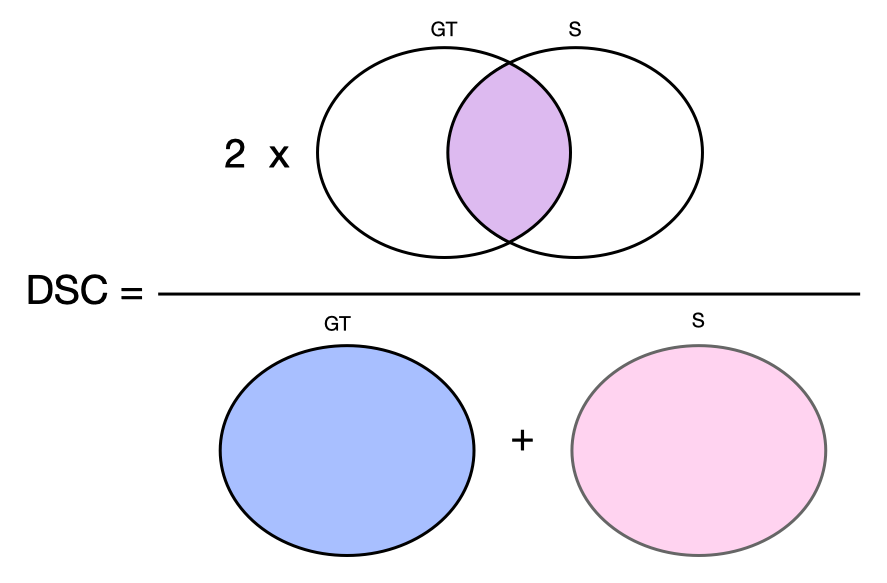
- DSC is computed as twice the size of the intersection of S and GT divided by the sum of their areas:
\displaystyle DSC = \frac{2 \times \lvert GT \cap S \rvert}{\lvert GT \rvert + \lvert S \rvert} - If TP = GT \cap S,
GT = TP + FN
and
S = TP + FP (see figure above), we can then rewrite the formula as:
\displaystyle IoU = \frac{2 \times TP}{2 \times TP + FN + FP}
The following illustration provides a visual representation of the DSC formula.
- DSC can also be interpreted as the harmonic mean of sensitivity and precision [1], where:
- Precision is the ratio of TP to all positive outcomes
\displaystyle Precision = \frac{TP}{TP + FP} - Recall, also called sensitivity or true positive rate, is the ratio of TP to all the outcomes that really are positive
\displaystyle Recall = \frac{TP}{TP + FN}
- Precision is the ratio of TP to all positive outcomes
Notes and comments
Intuitive IoU
IoU provides an intuitive assessment of segmentation performance, as it directly compares the number of overlapping pixels (or voxels) to the total area covered by both S and GT [3].
Metric ranges
Both metrics yield 1 for a perfect alignment between both segmentations and 0 for no overlap.
Application in object detection
IoU is frequently used in object detection as a supporting metric to determine whether a predicted bounding box is a true positive, a false positive, or a false negative [2].
Difference in weighting
Both metrics penalize false positives and false negatives. Dice emphasizes overlap by doubling the weight of true positives. IoU treats TP, FP, and FN equally. As a result, for the same level of overlap, Dice usually produces higher values than IoU (except when the segmentation is perfect and both metrics reach 1). This makes Dice appear more optimistic while IoU is stricter [3].
Exclusion of true negatives
True negatives are usually left out of overlap-based metrics as IoU and DSC. Background inclusion would make the scores appear unrealistically high and hide errors in the smaller, more important structures we actually want to evaluate. [4].
Sensitivity to region size
Both Dice and IoU are affected by the size of the segmented region. However, since Dice emphasizes overlap, it is usually less harsh. For example, for the same amount of misalignment between two segmentations, IoU tends to drop more steeply than Dice when the segmented object is small. [4].
Attention to context
While DSC and IoU are valuable indicators, they do not fully reflect segmentation quality. Their interpretation should take into consideration the specific application context [4]. Factors such as object size variability, class imbalance, or cases with no TP segmentations can strongly affect their behavior. For readers interested in a more detailed discussion of the limitations, reference [3] provides an excellent overview.
Dice as standard metric
Both scores are widely used in practice. However, DSC has been more extensively studied and validated in the medical imaging literature [1], making it the standard choice in clinical research for evaluating segmentation methods.
Example: IoU and DSC sensitivity to segmentation size
|
In this example, we fix the FN and FP values and calculate IoU and DSC for both a large and a small TP. For the same FN and FP, both metrics are sensitive to the segmentation size. However, IoU decreases more sharply for smaller regions, making it more sensitive than DSC. Consider this case: 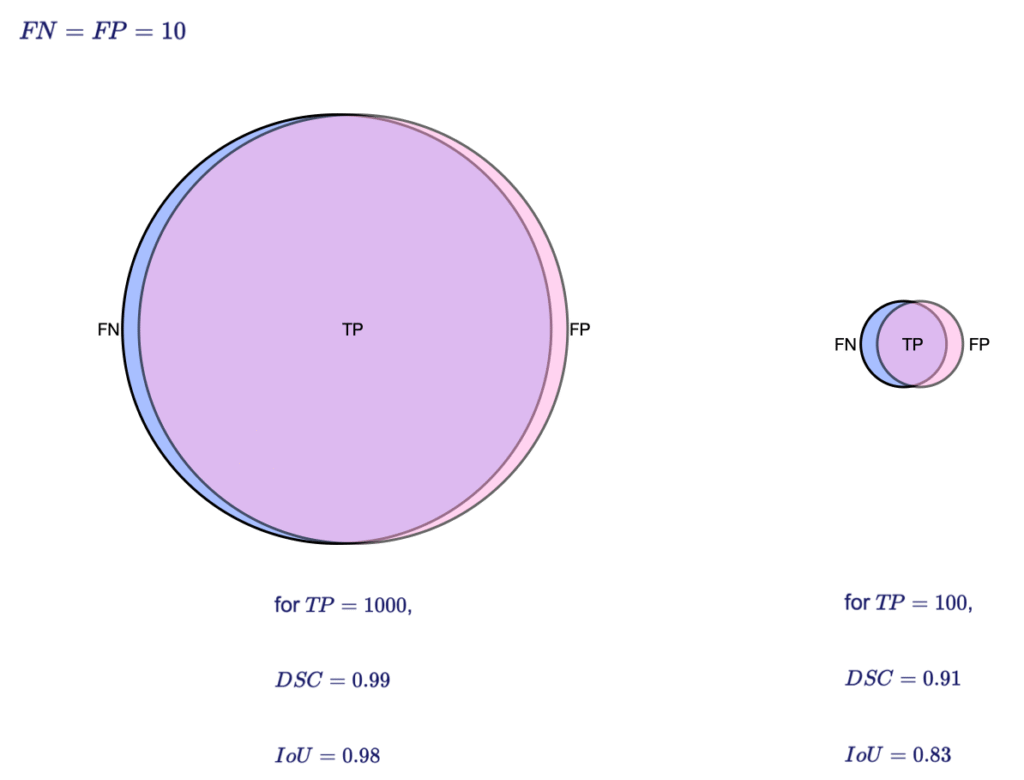 |
How to choose your metric?
Based on the properties of Dice and IoU, the following guidelines can help in selecting the most appropriate metric:
It is also helpful to complement overlap-based metrics with standard accuracy measures like precision and recall for a fuller picture of segmentation performance [4].
Keep in mind that both Dice and IoU focus primarily on overlap rather than boundary accuracy [4]. If precise contour delineation is important for your application, consider supplementing these metrics with visual inspection or additional measures such as Hausdorff distance.
DSC vs. IoU Conversion
DSC and IoU can be converted into one another [3].
Consequently, Dice scores are usually higher than IoU for imperfect segmentations, while both reach 1 when there is an exact match between GT and S [4].
| \displaystyle DSC = \frac{2 \times IoU}{IoU + 1} |
| \displaystyle IoU = \frac{DSC}{2 - DSC} |
| \displaystyle DSC \geq IoU |
Conclusion
Dice and IoU are essential metrics for evaluating segmentation performance, each with its strengths and limitations. IoU is stricter, weighing false positives, false negatives, and true positives equally, while Dice emphasizes overlap, making it generally less harsh, especially for small or imperfect segmentations.
Choose IoU when strict penalization of over- or under-segmentation matters, and Dice when maximizing overlap is the priority. Reporting both metrics together provides a more comprehensive view of model performance.
Since both focus on overlap rather than boundary accuracy, consider complementing them with visual quality assessment or other measures, such as Hausdorff distance, for applications where precise contours are critical.
◆ I work with medical imaging AI teams on questions related to data readiness, evaluation rigor, and technical defensibility across the AI R&D lifecycle.
Feel free to explore my Advisory page or to get in touch if these topics resonate with the challenges you are facing.
Found this useful? Spread the word.
References
[1] D. Müller, I. Soto-Rey, and F. Kramer, “Towards a guideline for evaluation metrics in medical image segmentation,” BMC Res Notes, vol. 15, no. 1, p. 210, June 2022, doi: 10.1186/s13104-022-06096-y.
[2] Kukil, “Intersection Over Union IoU in Object Detection Segmentation.” Accessed: Aug. 26, 2025. [Online]. Available: https://learnopencv.com/intersection-over-union-iou-in-object-detection-and-segmentation/
[3] M. L. Seghier, “Image Segmentation Evaluation With the Dice Index: Methodological Issues,” International Journal of Imaging Systems and Technology, vol. 34, no. 6, p. e23203, 2024, doi: 10.1002/ima.23203.
[4] B. Kocak et al., “Evaluation metrics in medical imaging AI: fundamentals, pitfalls, misapplications, and recommendations,” European Journal of Radiology Artificial Intelligence, vol. 3, p. 100030, Sept. 2025, doi: 10.1016/j.ejrai.2025.100030.