
Case Studies
Project: NIH ChestX-ray14 Data Due Diligence Evaluation
|
Dataset Scale: 112,120 images / 30,805 patients |
|
Objective: Applying the VeraDP Data Due Diligence Protocol to identify the dataset’s strengths, limitations, and risks |
|
Identified Risks:
|
|
Strategic Outcome: The evaluation provides a framework for judgment under uncertainty, allowing R&D teams to account for data limitations before locking in technical and validation strategies. |
Project: Evaluation Design of an AI System Trained on the NIH ChestX-ray14 Dataset
|
From data findings to evaluation strategy |
|
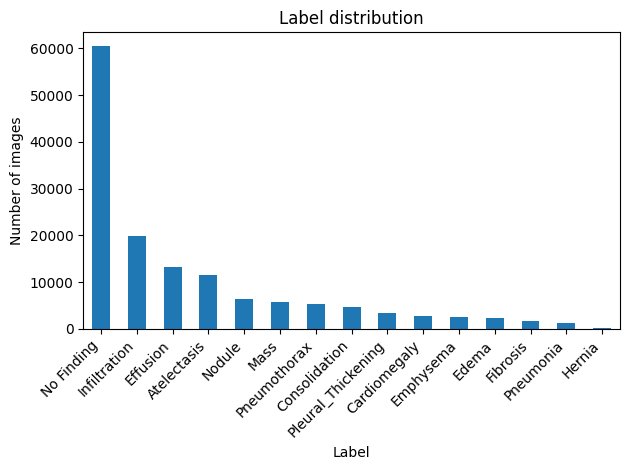
What the label distribution tells us
|
|
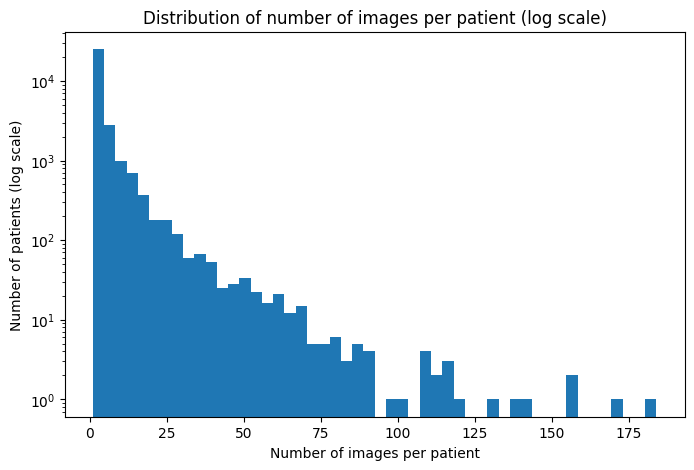
What the patient distribution tells us
This asymmetry makes patient-level data splitting mandatory to prevent data leakage between train, validation, and test sets. |
|
Proposed evaluation strategy
Without data due diligence, there is no reliable evaluation design. The data determines the strategy before any model development begins. |
From data evidence to technical decisions
The findings from the Data Due Diligence and Evaluation Design studies raise a practical question that any R&D team must address before model development: what do we do with the minority classes?
Observations
- 9 out of 14 pathology classes represent less than 5% of the dataset each.
- At this level of representation, training a classification model on these classes is unlikely to yield reliable performance and may introduce false confidence if global metrics are used without scrutiny.
A considered option: OOD-by-design
Rather than forcing the model to learn from insufficient data, one strategic option is to:
- deliberately exclude these extreme minority classes from training
- reserve them exclusively for out-of-distribution (OOD) testing.
This transforms a dataset limitation into a reliability instrument:
- The model is trained on classes with sufficient representation
- Minority class images become a dedicated OOD test set
- The model’s behavior on these unseen classes provides measurable evidence of its generalization limits.
This approach produces a reliable system with known and documented boundaries, which privileges a strong clinical and regulatory position.
This data due diligence makes one thing clear: ignoring minority class representation is not a neutral choice. The right strategy depends on clinical objectives, regulatory pathway, and acceptable risk thresholds.
VeraDP provides the clarity and the options. Technical decisions can now be made on solid ground.
Context
CT reconstruction algorithms can substantially alter image appearance, noise characteristics, texture, and sharpness. As a result, reconstruction settings may influence the behavior of AI systems and should not necessarily be treated as simple protocol descriptors. They may instead represent acquisition-state variables against which a model should be validated and monitored.
GammaMetric [1] investigated whether reconstruction characteristics could be identified directly from image pixels independently of DICOM metadata availability or quality. Such an approach could support local acceptance testing and drift monitoring by verifying whether incoming images remain within validated acquisition conditions.
Before model development, however, a key question needed to be addressed:
Can reconstruction metadata be considered reliable ground truth for a reconstruction classification study?
VeraDP’s Contribution
VeraDP conducted a metadata traceability assessment on the QIBA [2] dataset from TCIA [3].
The objective was to evaluate whether reconstruction-related metadata could be considered reliable ground truth for model development and validation.
The goal was to identify which reconstruction descriptors were directly observable, which were inferred, and which required further validation before being used as reference information.
Dataset Scope
The QIBA dataset includes 3 sets of CT scan images acquired from anthropomorphic phantoms with replaceable liver inserts. Acquisition and reconstruction parameters were deliberately varied, including tube current, slice thickness, reconstruction algorithm, convolution kernel, and pitch.
Because these factors were controlled during acquisition, the dataset provided a suitable environment for investigating reconstruction traceability and metadata reliability.
The assessment combined online dataset documentation, metadata spreadsheets, and DICOM headers.
Key Findings
1. Documentation mismatch in dataset size
The dataset documentation indicates 642 scans. The accompanying metadata spreadsheet contains 684 unique series, while 627 unique DICOM series were identified in the downloaded data.
Conclusions:
- The DICOM series constitute the most directly verifiable source and can therefore be used as the reference count.
- Cross-referencing the metadata spreadsheet against the available DICOM series is recommended to ensure that only metadata corresponding to available image series are used.
2. Images with low slice count
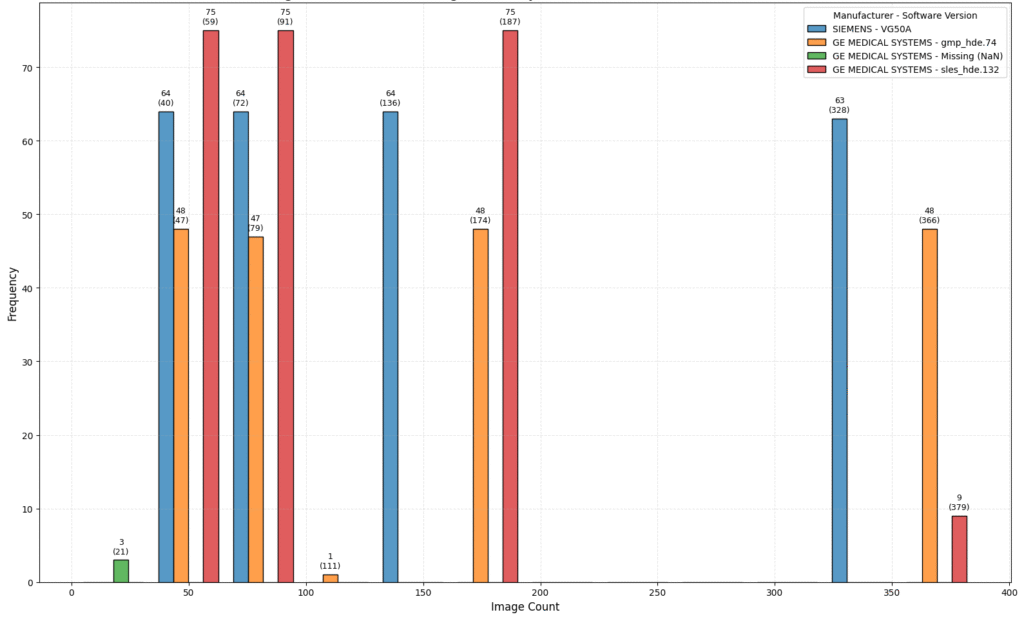
Three CT series contained only 21 slices.
Conclusion: These series should be treated with caution (identified and possibly excluded), as their unusually low slice count may provide an alternative explanation for unsatisfactory results independently of reconstruction characteristics.
3. Incomplete reconstruction descriptors
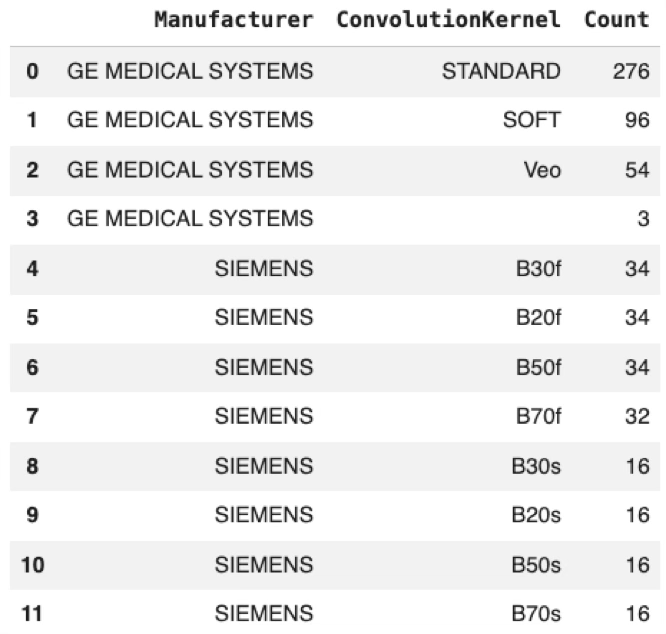
The ConvolutionKernel DICOM tag distribution revealed three GE series for which no reconstruction kernel could be identified from the available metadata.
Conclusion: Although limited in number, these series illustrate that reconstruction metadata may be incomplete even within a controlled dataset and should not be assumed to be universally available.
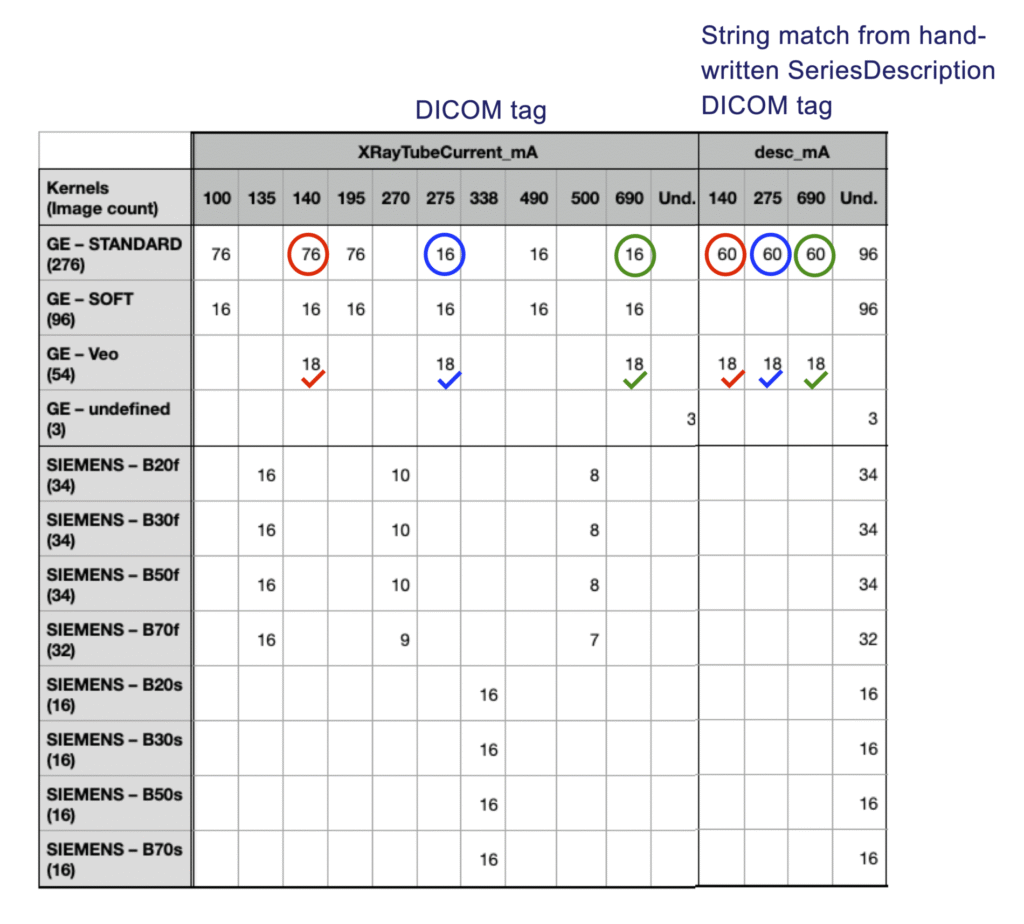
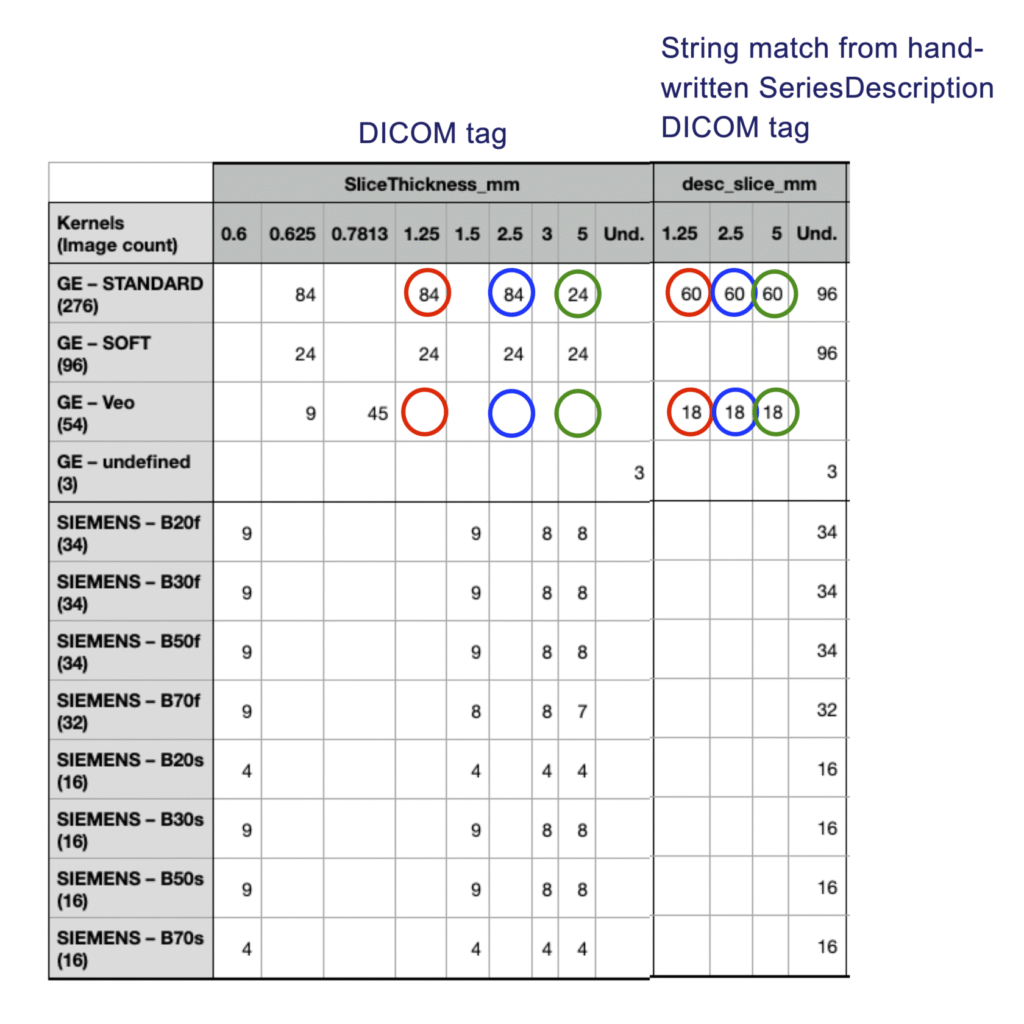
4. Discrepancies between string-extracted and standard DICOM tags
Additional acquisition parameters were extracted from the SeriesDescription field using regular expressions. These values were then compared against the corresponding standard DICOM tags.
Discrepancies were identified for both slice thickness and tube current.
Conclusion: Metadata derived from SeriesDescription should not be considered reliable ground-truth information without additional validation against standard DICOM metadata.
5. Manufacturer-dependent reconstruction metadata
Reconstruction-related metadata availability differed across manufacturers. For example, GE reconstruction information may be available through private tags, while no equivalent source was identified for the Siemens reconstruction families present in the dataset. Furthermore, private reconstruction tags were not consistently available across all GE series.
Conclusion: Reconstruction metadata availability is manufacturer-dependent, limiting the possibility of relying on a single reconstruction reference strategy.
Impact
| Observation | Implication |
| Documentation mismatch in dataset size | Ensure labels are generated only for image series actually available in the dataset. |
| Images with low slice count | Investigate potential confounding factors before attributing performance differences to reconstruction characteristics. |
| Incomplete reconstruction descriptors | Expect missing labels and define a strategy for handling unlabeled series. Given that only three affected series were identified, exclusion may be a practical and defensible option. |
| Discrepancies between string-extracted and standard DICOM tags | Avoid treating text-derived parameters as reference labels without verification. |
| Manufacturer-dependent reconstruction metadata | Reconstruction labeling strategy needs to differ between manufacturers. Manufacturer-specific label generation rules may be required. |
By clarifying metadata traceability before experimentation, the study provided a more defensible foundation for subsequent reconstruction classification work.
Note: Dataset download and DICOM metadata extraction were performed by GammaMetric. VeraDP conducted the metadata traceability assessment and evaluated the suitability of reconstruction metadata as ground truth for reconstruction classification.
References
[1] https://gammametric.com/
[2] https://www.cancerimagingarchive.net/collection/qiba-ct-liver-phantom/
[3] https://www.cancerimagingarchive.net/